
We’ve been developing a Quantified College initiative, in an effort to gather and represent lots of data at a variety of scales, macro to micro. The plan is to collect as much data as possible, from weather to the microbiome of the college, and then explore ways to represent those data while providing students with hands-on experiences. A big part of the plan is data sonification, using low tech means – music box mechanisms – and high-tech ones – a Eurorack synth we’re in the process of building out. Faculty, staff, and a student prototyped the former during our most recent Maker Wednesday session, using wind data from a weather station we recently installed outside the Innovation Center. Diane Carlson (Sociology) transferred the wind graph to the piano roll-style music box card…
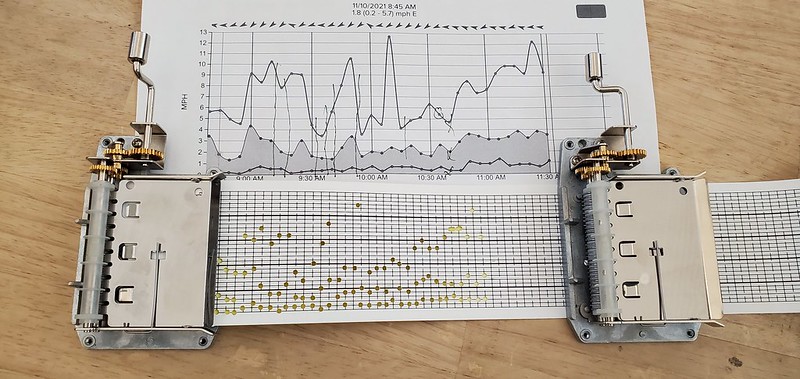
…which sounded like this:
Here’s what it sounded like inverted (with the roll upside down, resulting in the higher pitched notes becoming lower pitched ones, and vice versa):
Pingback: The Sound of Blue – FLC Innovation